7 Poster feedback
and desired adjustments for the written report
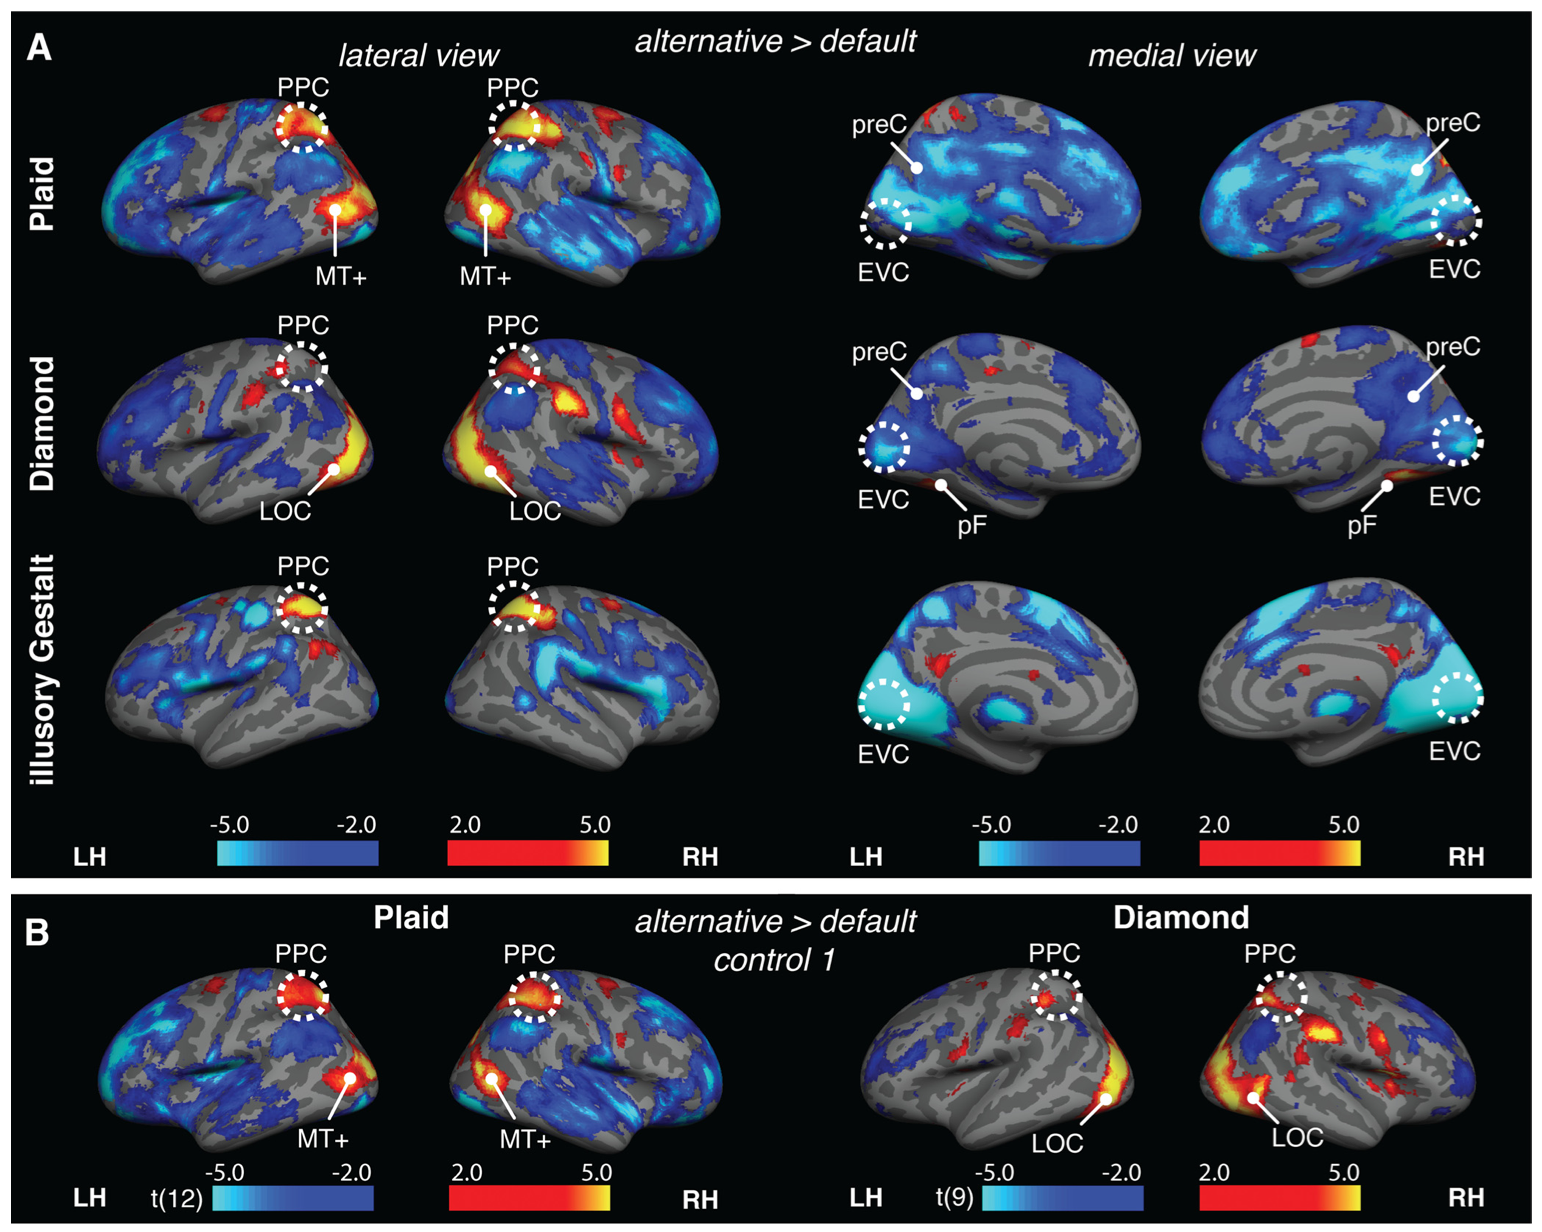
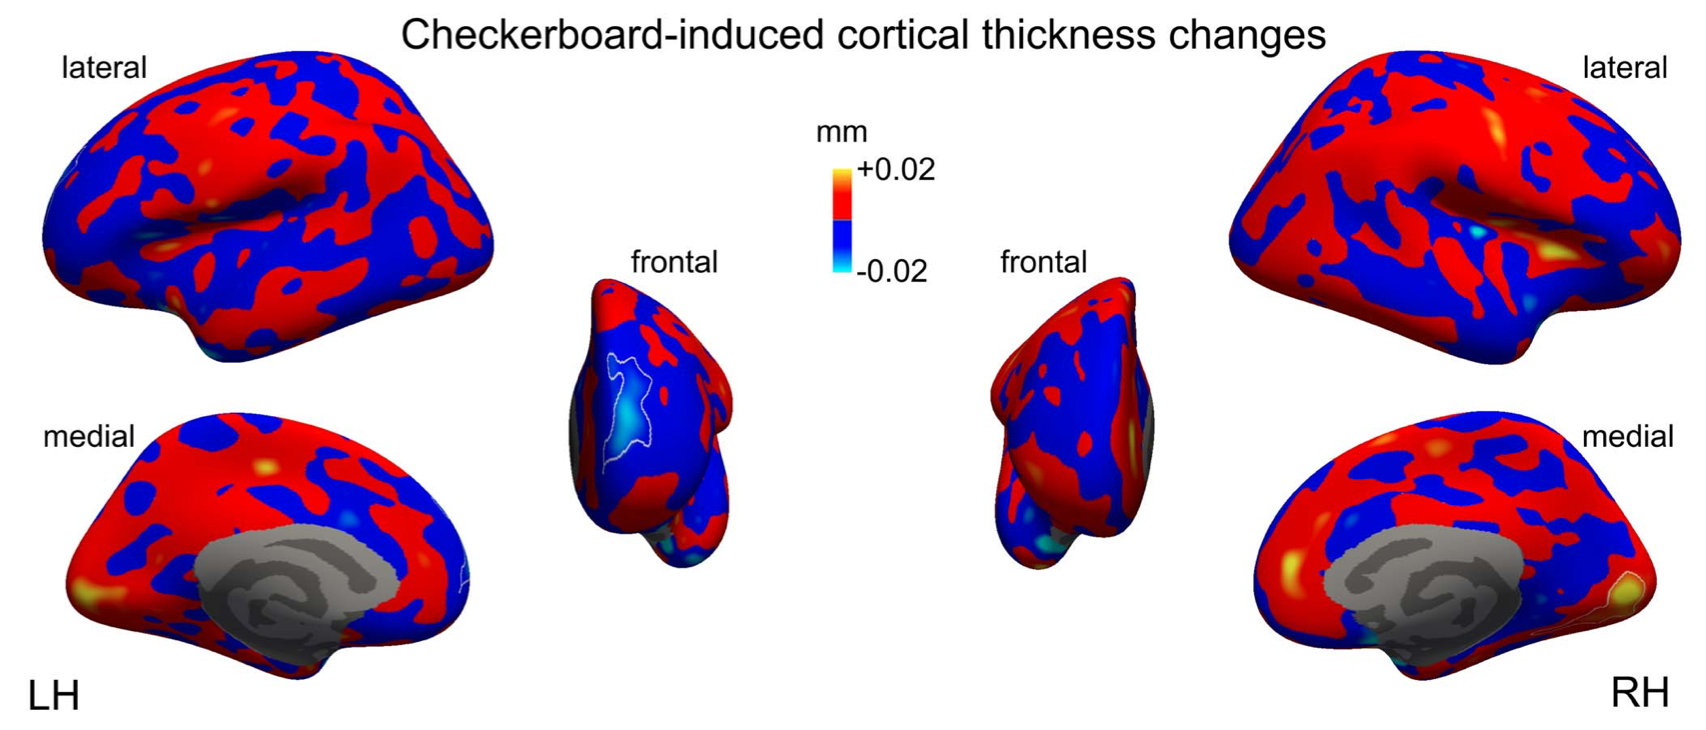
Hemisphere labels
Especially for the volume data, it should be clear which hemisphere is left and which is right, because these are inverted in the radiological convention
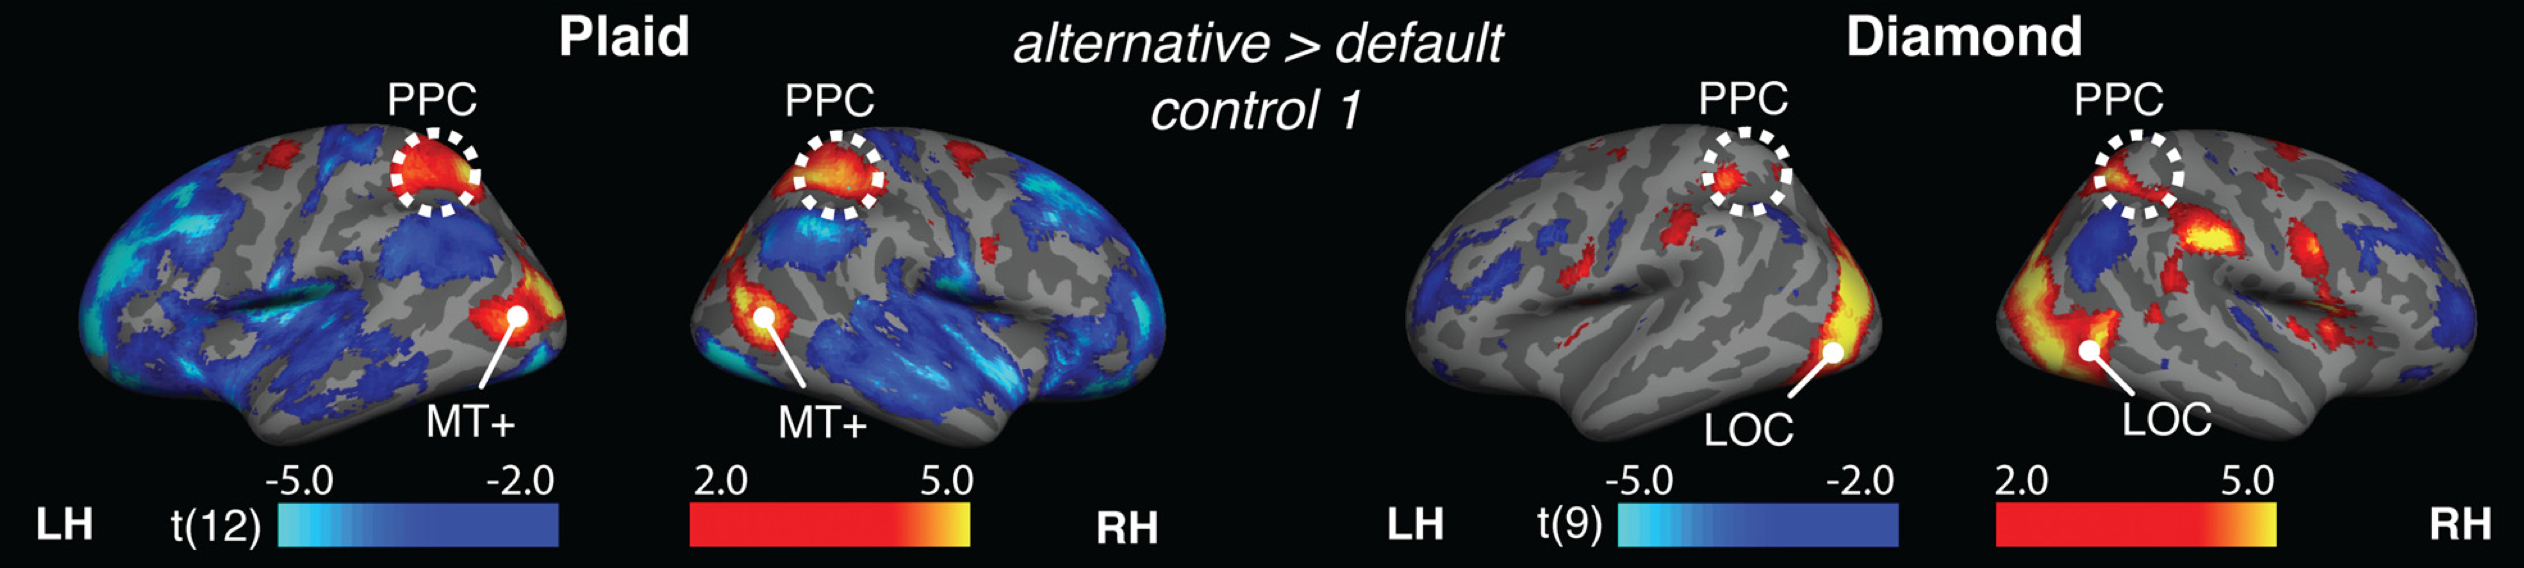
Contrast
Is typically indicated in the title of the figure
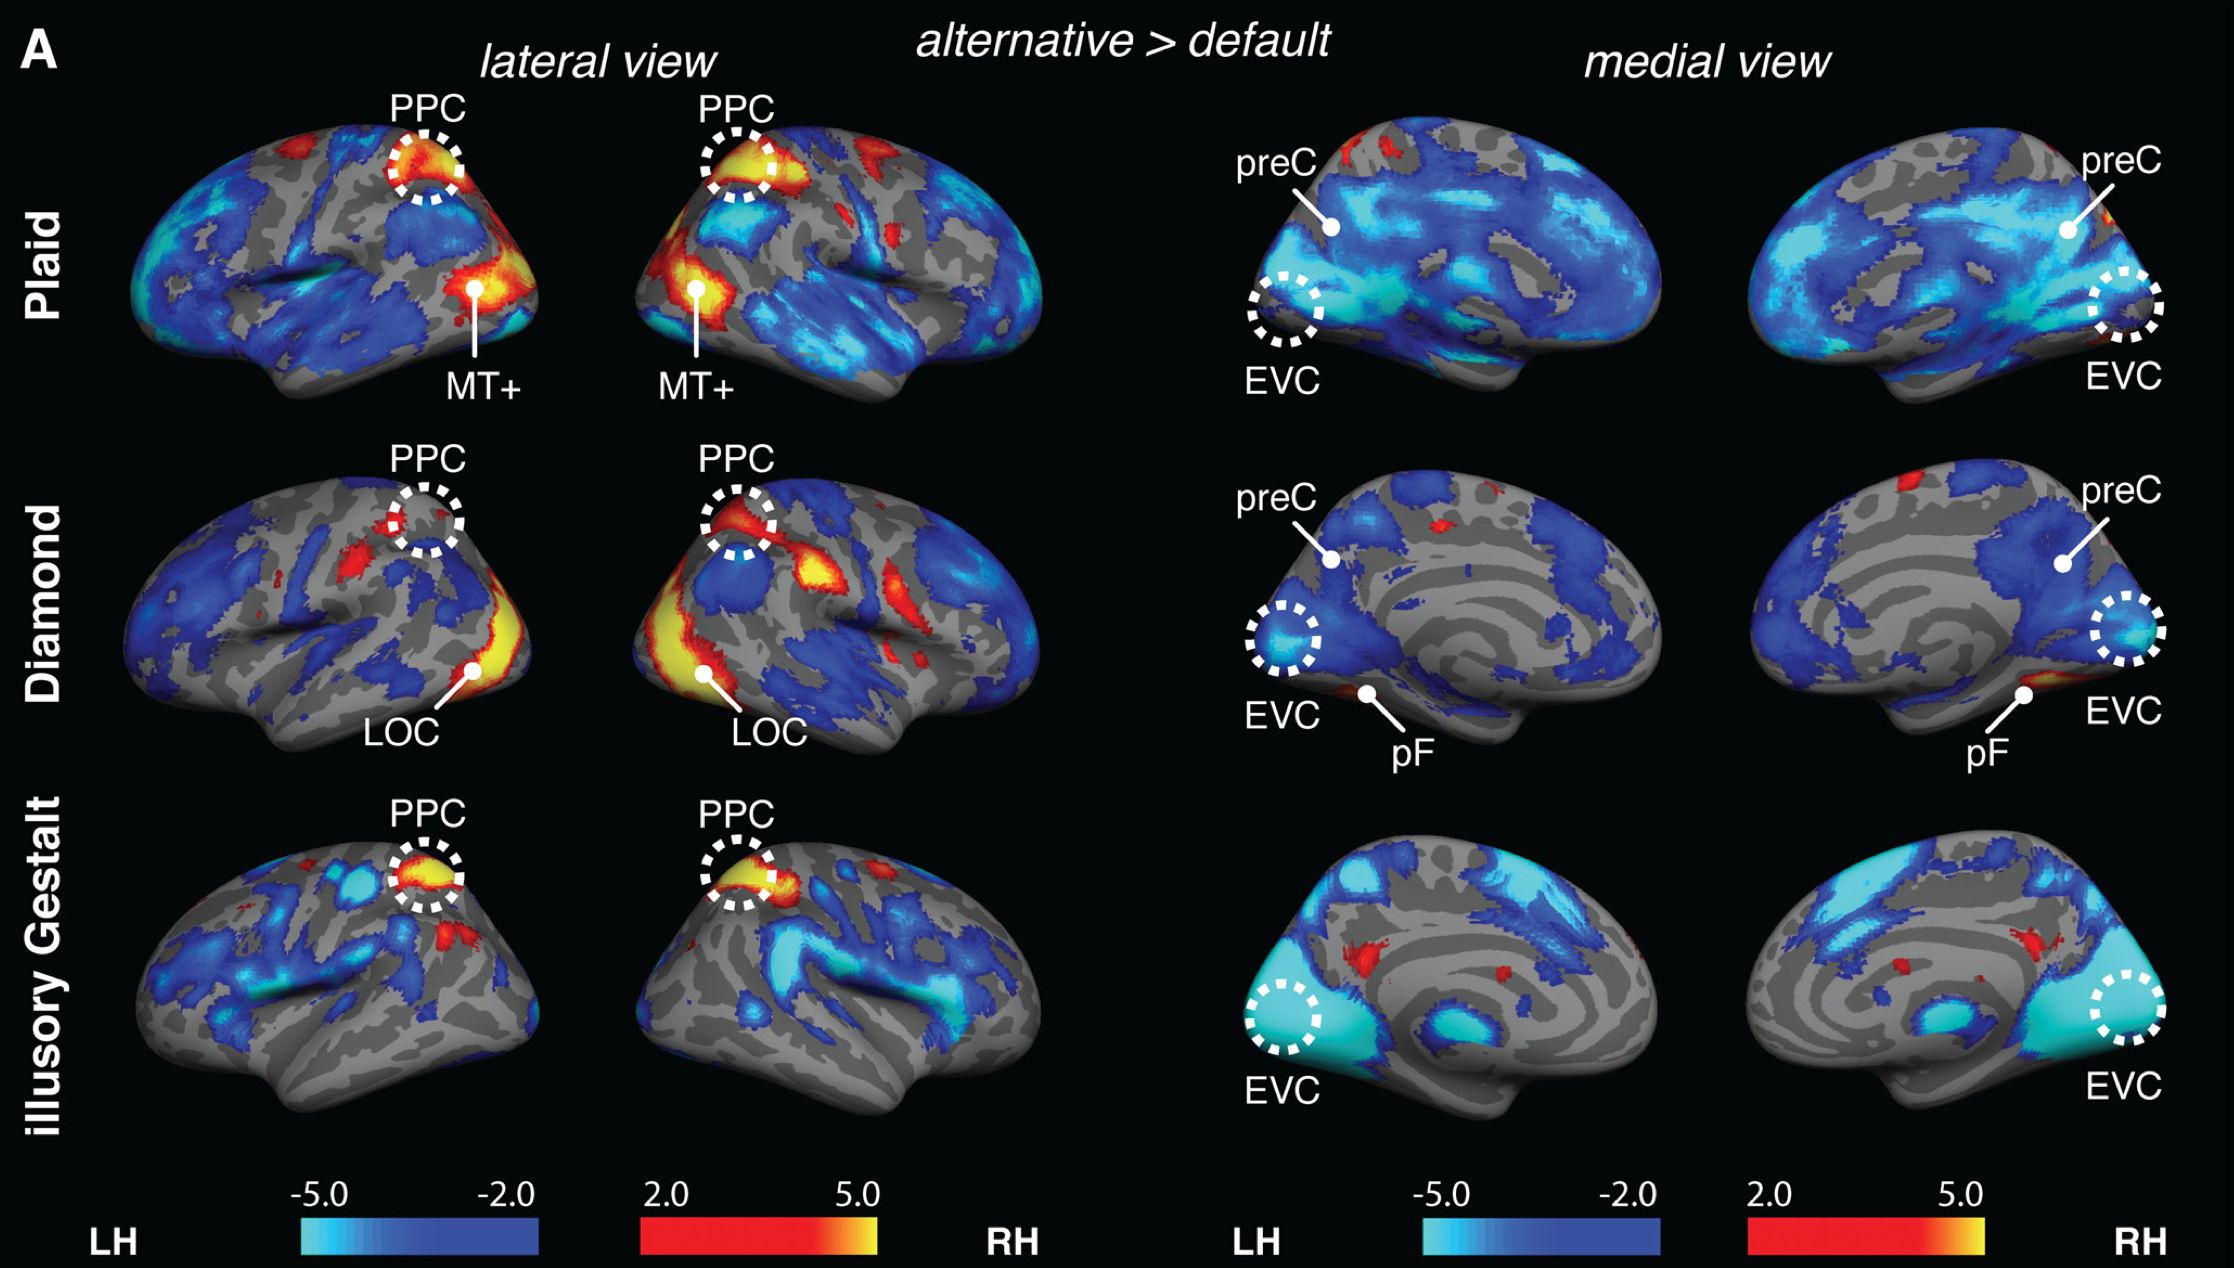
It should be clear to the reader/viewer what they are looking at without looking for it for a long time
Color bar
Should have a label indicating the meaning of the colors
Examples include: t-value, z-value, -log10(p)
Symmetric color scale
So that there is no color bias toward activations/deactivations
Usually it implies a two–tailed test
Identical color scales for similar plots
Important for comparability
Statistical threshold and MCC
Is typically indicated directly in the image
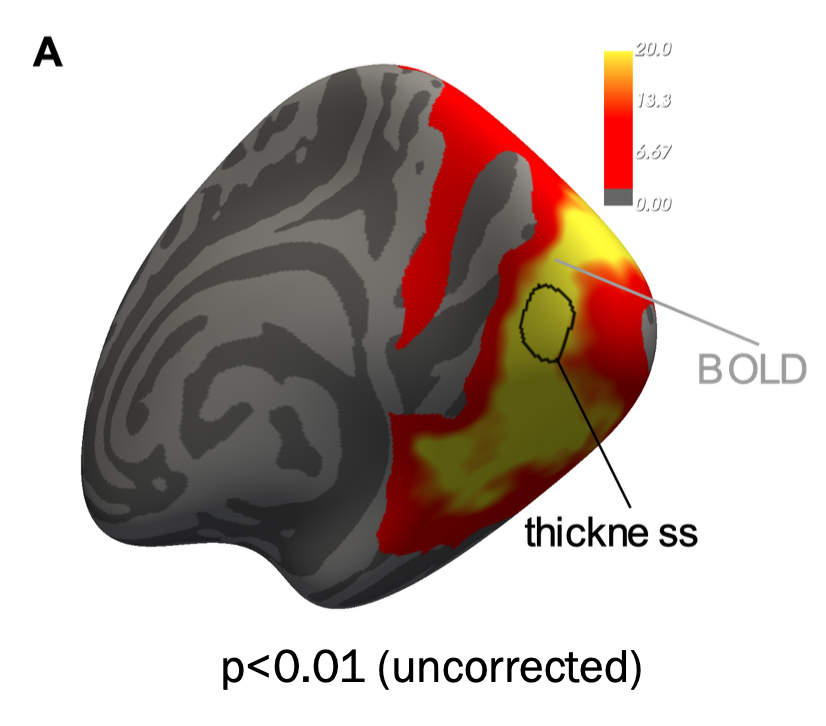
It is important to be transparent about the thresholds used
Too much activity
Usually means that the contrast is not very specific
In the worst case: threshold increase to emphasize the peaks
References
Grassi, Pablo R, Natalia Zaretskaya, and Andreas Bartels. 2018. “A Generic Mechanism for Perceptual Organization in the Parietal Cortex.” The Journal of Neuroscience 38 (32): 7158–69. https://doi.org/10.1523/JNEUROSCI.0436-18.2018.
Zaretskaya, Natalia, Erik Fink, Ana Arsenovic, and Anja Ischebeck. 2022. “Fast and Functionally Specific Cortical Thickness Changes Induced by Visual Stimulation.” Cerebral Cortex, July. https://doi.org/10.1093/cercor/bhac244.